Your activation metrics
are lying to you.
Averages hide the 40% of users stuck in onboarding. Tivalio shows you the full Time To Value distribution, tells you exactly which users are slow, and runs the research to prove why — on your own data.
Free. No credit card. 5 minutes to first insight.
Connect in minutes. Your data stays where it is.
Charts don't answer why.
Traditional analytics tools show you a line going down. They don't tell you which cohort broke it, which onboarding step added friction last Tuesday, or why power users from paid channels activate 4× faster than organic signups.
You end up clicking dropdowns for three hours and guessing.
- Averages hide your worst-performing cohorts
- Segment analysis is a dropdown-clicking marathon
- You find problems days after they impact revenue
- "Activation rate" doesn't tell you what to fix
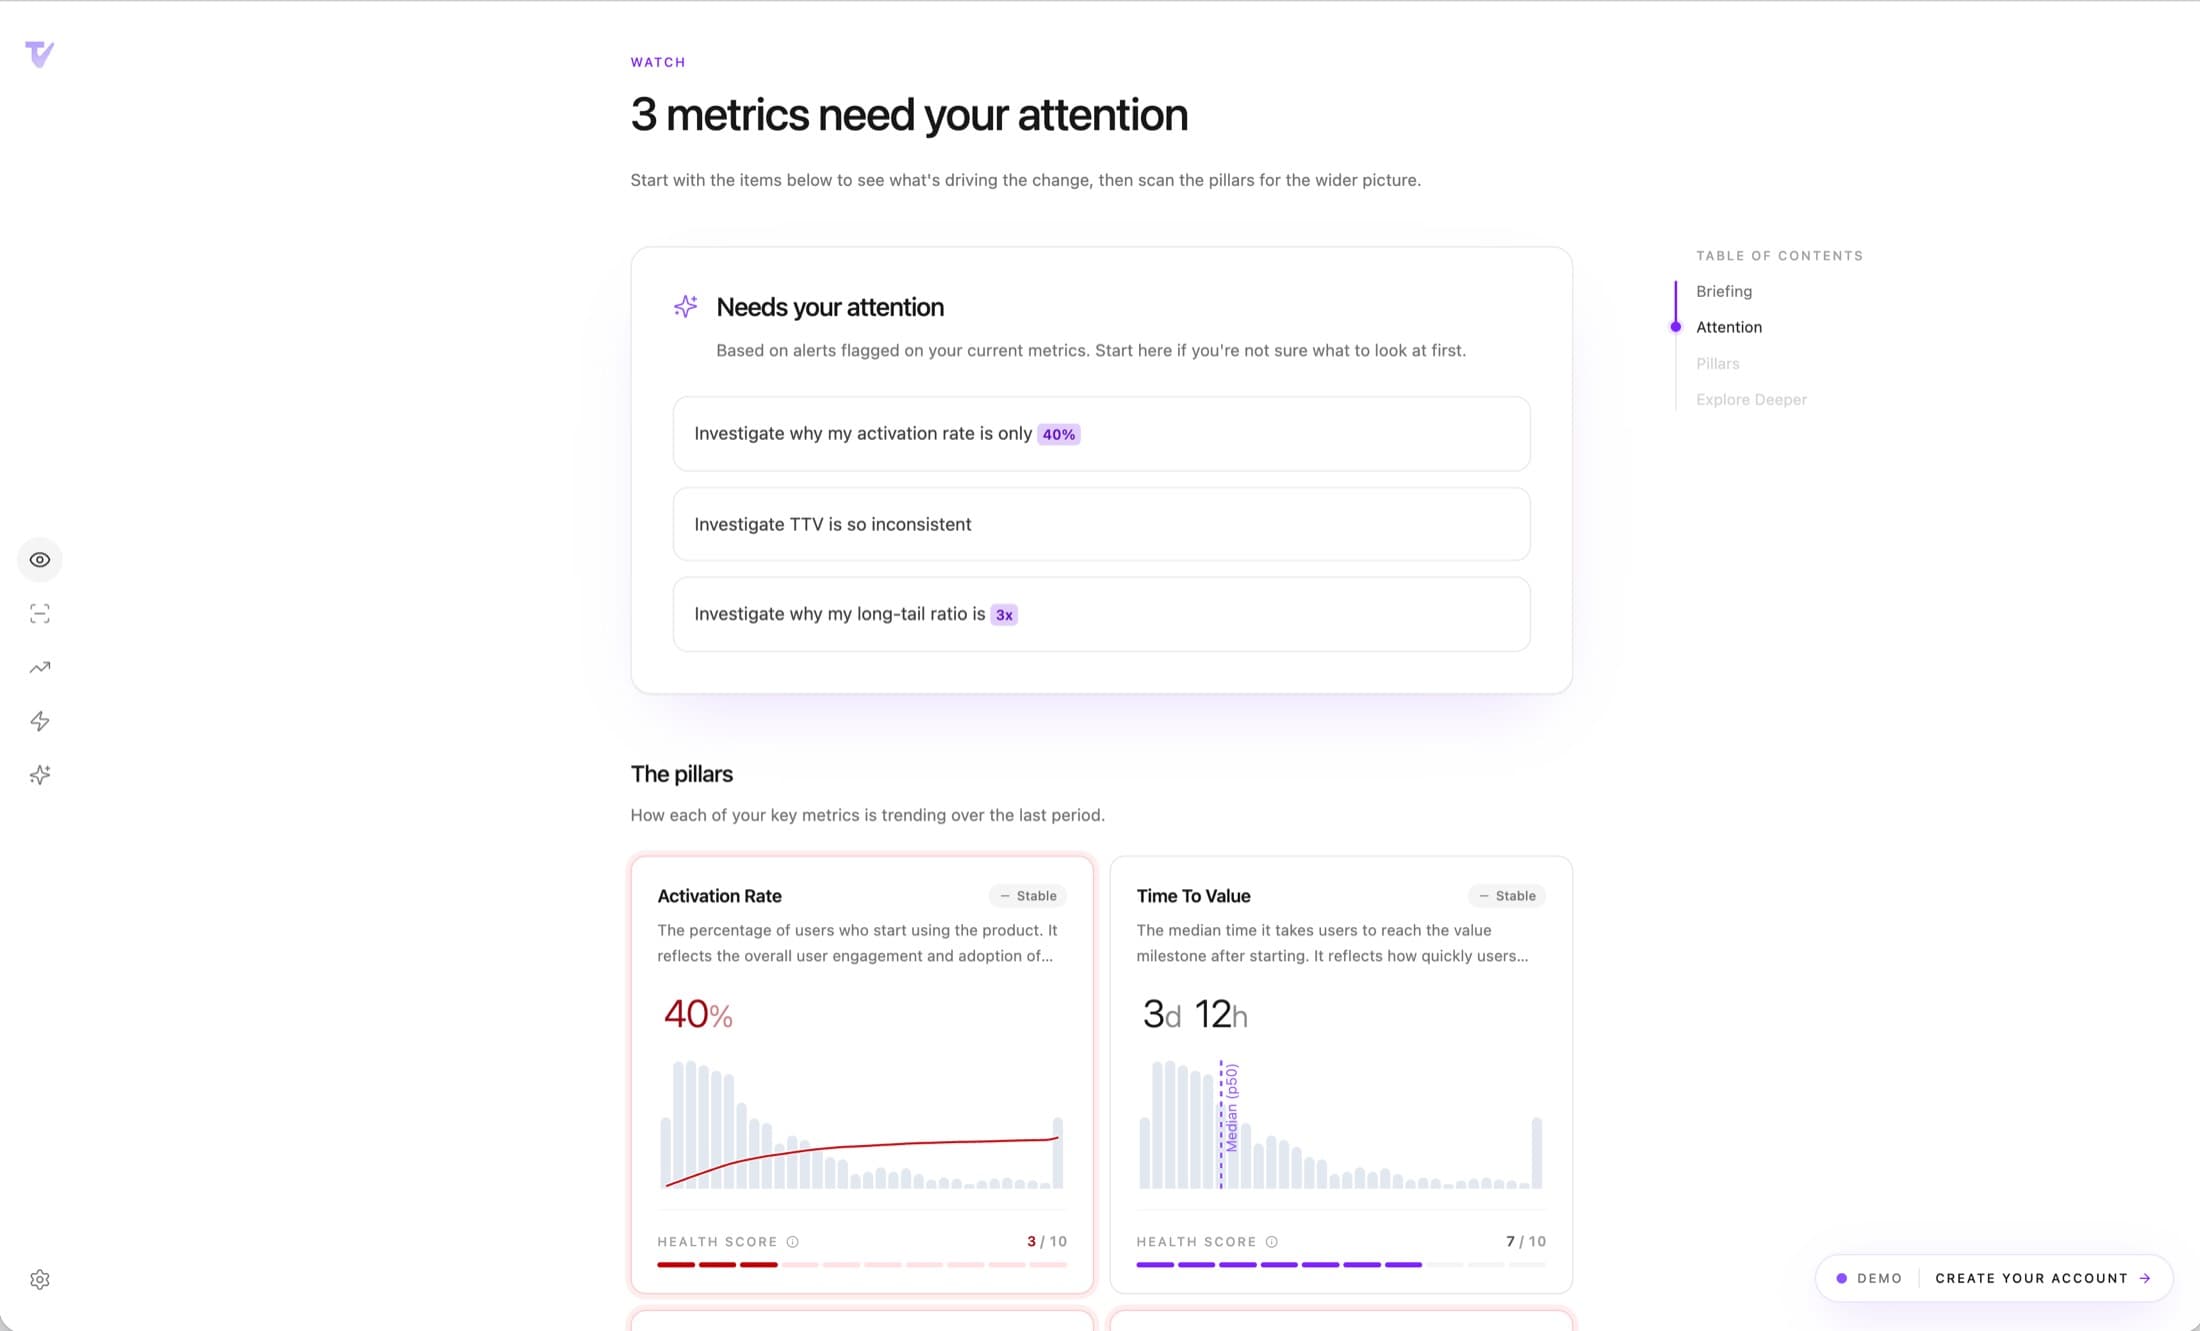
Tivalio tells you what broke.
Every morning, Watch runs a full health check on your activation funnel. It scores each key metric, flags degradations before they hit revenue, and points you to the exact research that will explain the cause.
- Automatic anomaly detection across cohorts
- Distribution shifts, not just averages
- Daily briefing in 20 seconds
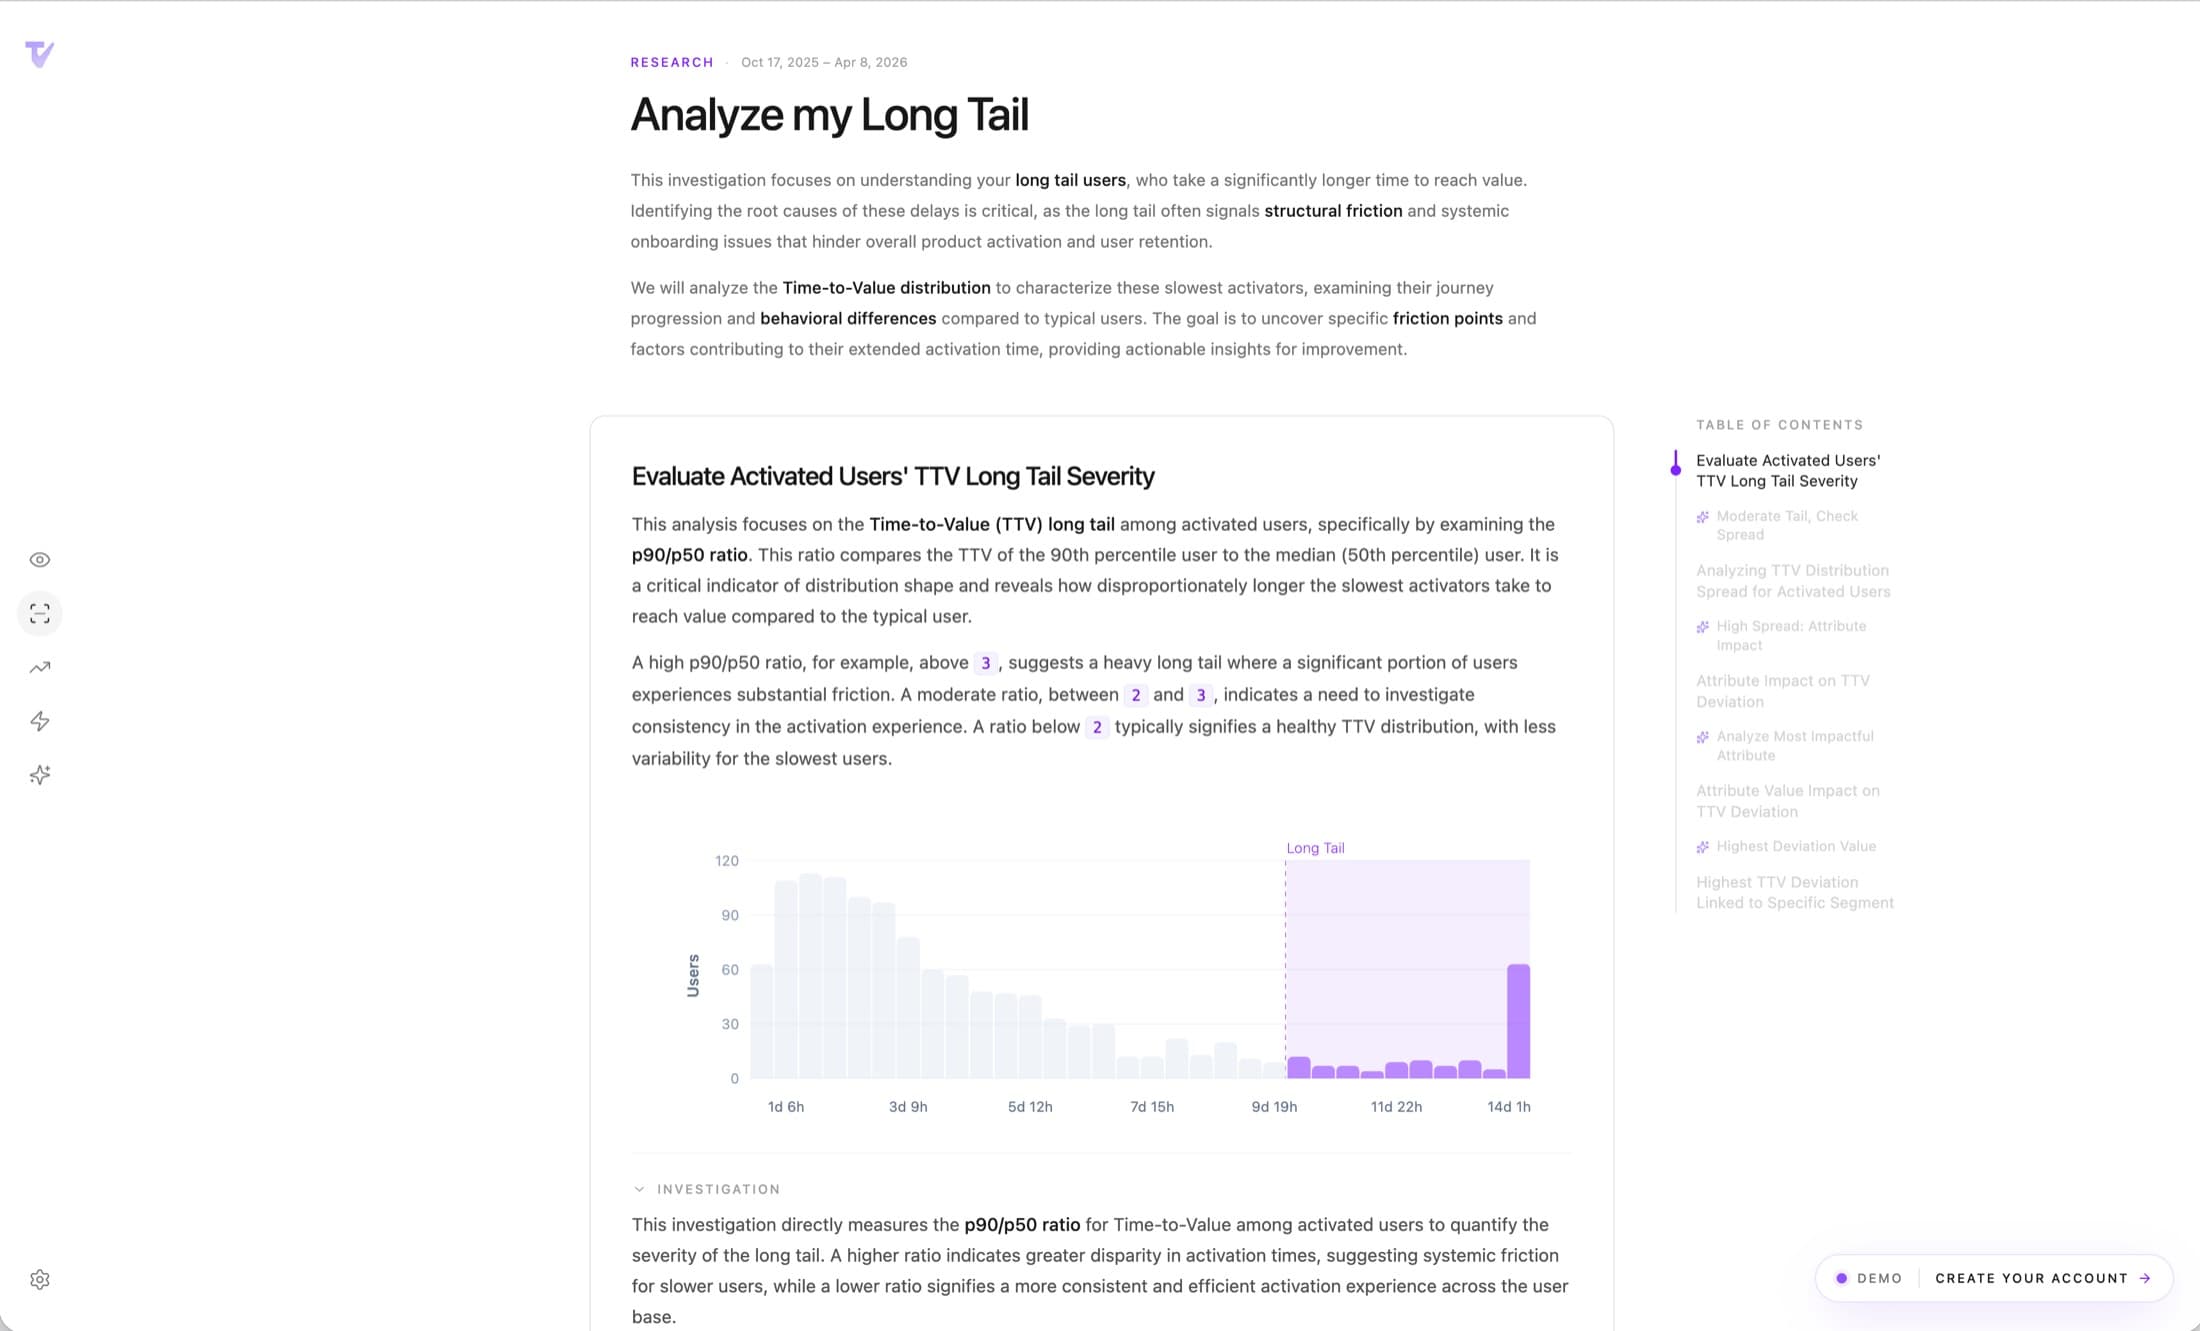
Then it tells you why, in minutes.
Click the alert and Tivalio opens a pre-built research — a structured investigation with steps, intermediate results, and a conclusion. Not a blank dashboard. Not 40 charts to figure out. 30+ research templates across Core Analysis, Trends and Drivers. Every one deterministic, reproducible, auditable.
- From alert to diagnosis in under 3 minutes
- Same question, same answer — every time
- No SQL, no dropdowns, no data team ticket
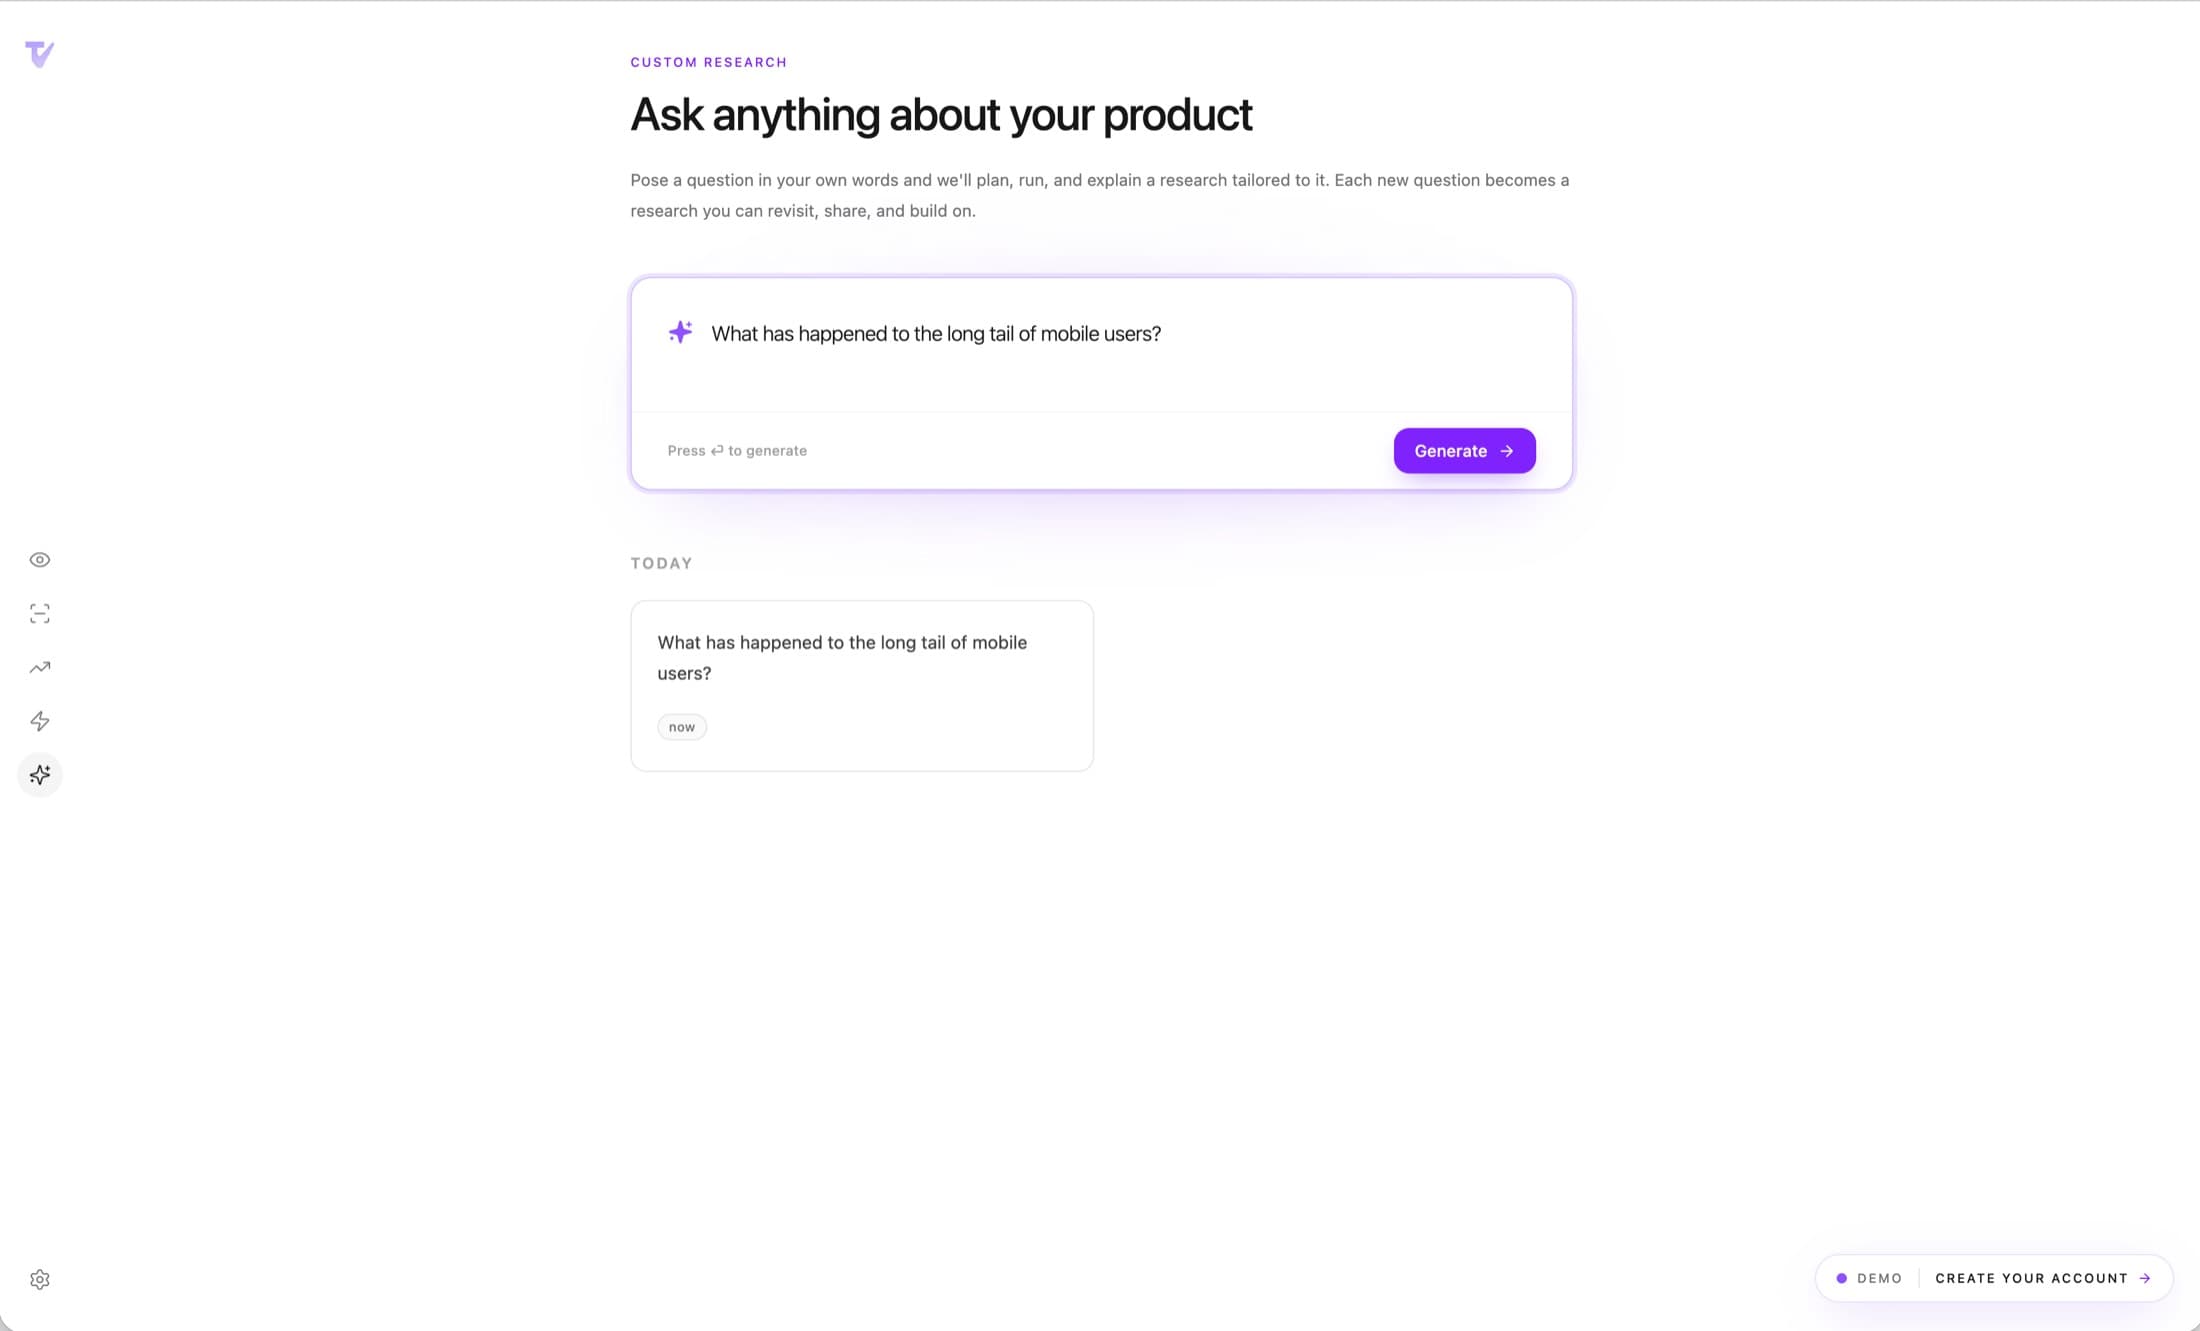
And when the template doesn't exist, ask.
Type the question in plain English. Tivalio runs a custom research — still deterministic, still reproducible, still auditable. No hallucinations. Every number is computed from your data, not imagined by a language model.
- Open-ended questions → structured research
- Every conclusion backed by real math
- Share a link, anyone can re-run it tomorrow
Tivalio tells you what broke.
Every morning, Watch runs a full health check on your activation funnel. It scores each key metric, flags degradations before they hit revenue, and points you to the exact research that will explain the cause.
- Automatic anomaly detection across cohorts
- Distribution shifts, not just averages
- Daily briefing in 20 seconds
Then it tells you why, in minutes.
Click the alert and Tivalio opens a pre-built research — a structured investigation with steps, intermediate results, and a conclusion. Not a blank dashboard. Not 40 charts to figure out. 30+ research templates across Core Analysis, Trends and Drivers. Every one deterministic, reproducible, auditable.
- From alert to diagnosis in under 3 minutes
- Same question, same answer — every time
- No SQL, no dropdowns, no data team ticket
And when the template doesn't exist, ask.
Type the question in plain English. Tivalio runs a custom research — still deterministic, still reproducible, still auditable. No hallucinations. Every number is computed from your data, not imagined by a language model.
- Open-ended questions → structured research
- Every conclusion backed by real math
- Share a link, anyone can re-run it tomorrow
From alert to answer in ~3 minutes —
down from 3 hours of dropdown clicking.
Two products can have the same mean TTV. One is fine. The other is bleeding users.
mean(cohort_A) == mean(cohort_B)
p75(cohort_A) = 6d    p75(cohort_B) = 19d
Three numbers, not one.
The mean says 5.2 days. The distribution tells a different story.
Your worst 10% of users are your future churn.
Every SaaS has a long tail of users who take 3× longer to activate. They're also 4× more likely to churn by day 30. Tivalio isolates them, shows you who they are, and runs the Drivers research that explains what's different about them.
See what actual Tivalio research looks like.
Every card below is a real research you can open, read, and re-run. No signup. No demo scheduler.
Every number is computed, not guessed.
Tivalio uses AI to understand your question. It never uses AI to invent the answer.
Every research is deterministic. Run it today, run it in six months, get the same result. Every conclusion is traceable to a calculation you can audit. No hallucinations, no “the model thinks your churn is high”, no black box.
Start free. Scale when it works.
No surprises. No per-seat pricing. Pay for answers, not dashboards.
Custom research and higher limits for growing teams.
- 10,000 MAU
- 10 Custom Research / month
- All research templates
- 30-day free trial
Stop reading dashboards.
Start answering questions.
Connect your data in 5 minutes. See your TTV distribution the same day.
Free forever · No credit card · Cancel anytime